Finding words in maps, part 2: seeing the results
The Living with Machines team are interested in finding text in historic maps and recently had a hack week where a group of us tried a tool called Strabo (by researchers at the University of Southern California Spatial Informatics Laboratory) designed to do exactly this. Our efforts are described in a post, Finding words in maps. Strabo aims to identify text on a map image, and then transcribes (or OCRs) these sections to produce computer-readable text. By the end of the week we had the tool working on some map images we are using in Living with Machines. But how successful is the tool with our maps? Strabo outputs an image, drawing outlines over the map where text is detected, and produces a separate data file (in a format called JSON) with these polygon coordinates and any output text data. But it is difficult to tell which sections it has produced text data for and how accurate that text data is.
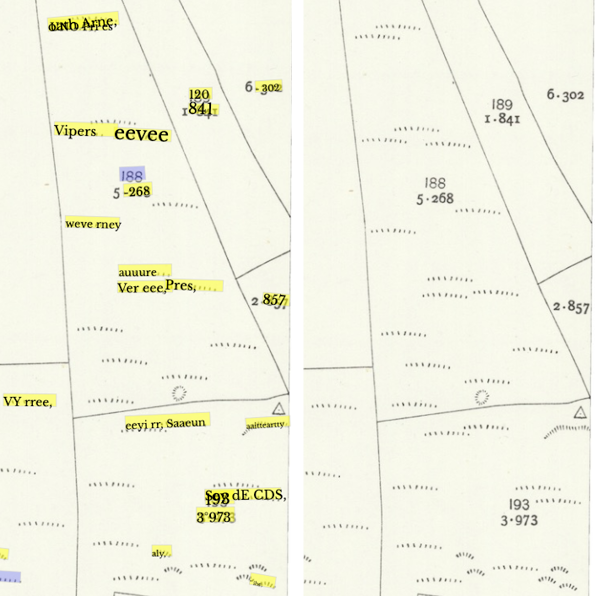
One way to get a better idea of how well the tool is doing is to draw the output JSON data back over the map. In the image below, the coloured shapes drawn over the map are where the tool detects there to be text: yellow where text data was produced with OCR; blue when it detected text but didn’t transcribe it. Any extracted text data is also written over the top. With sliders to adjust the different layers’ opacity, it is possible to get a better sense of the results quality and in what kinds of cases the tool is struggling. (Visualising the output JSON is done in JavaScript/d3.js). Reviewing the output of Strabo visually in this way is a step towards evaluating the quality of text recognition in historical maps.
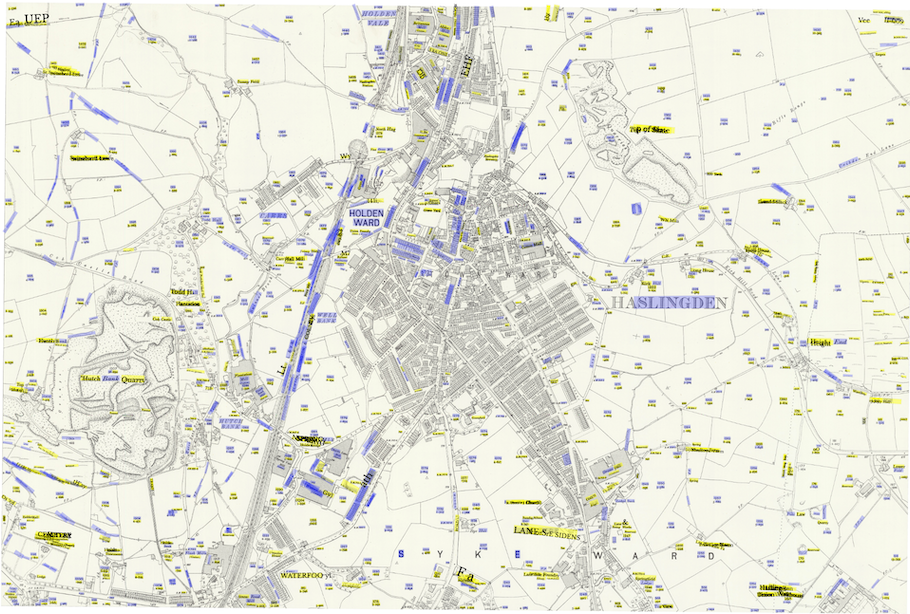
Survey date: 1890-2, publication date: 1911
Reproduced with the permission of the National Library of Scotland
For this particular map (Haslingden in Lancashire), what do we learn? We can see the tool has had mixed success. It detects some of the map text, but trips up on a fair amount of this in the OCR stage. It is having a particularly hard time with street names in the built-up town area. Looking in more detail, while the tool considers some of the buildings and part of the railway line are text, fortunately it largely does not produce text data for these.
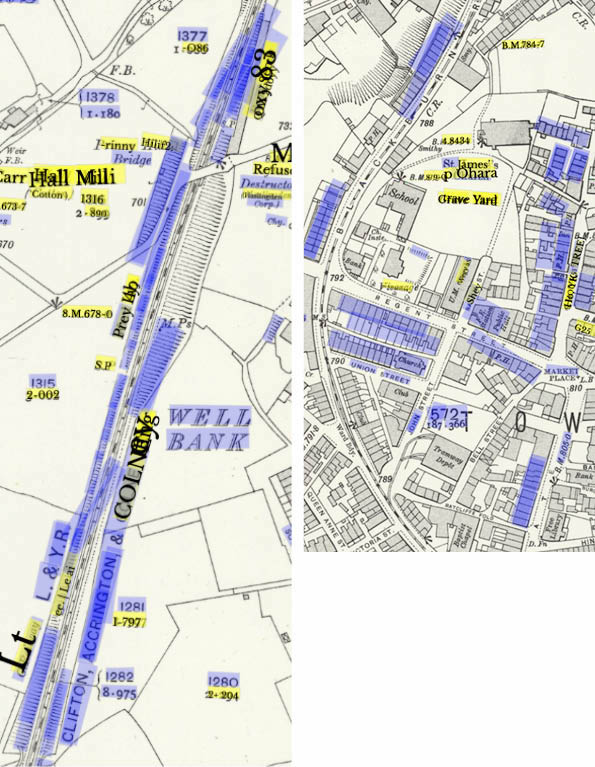
It may be doing a better job with particular typefaces. (Running OCR on historic documents commonly runs into problems when the typefaces are dissimilar from modern ones, which the software is optimised for). In this case, the tool is not obviously struggling with the more decorative 19th-Century typefaces (though it misses text which has very wide letter spacing). With field numbers, though, text data is often extracted for the bottom number, but not the top (which is a different typeface). Neither of these at a glance seem that far from modern typeface designs, though the OCRed typeface is a serif while the other is a sans-serif, which may be relevant?
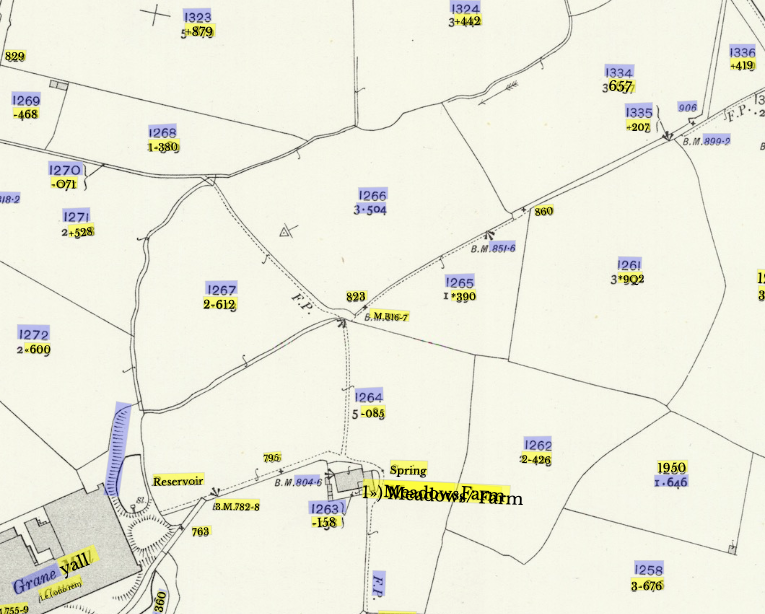
The tool mistakes particular visual elements for text, for example, it “reads” grass symbols. In some cases this produces nonsense, but in other cases actual words, eg. ‘Vipers’. This is something we need to watch out for in any future use!
This visualisation technique gives us quick, non-statistical feedback on the success of Strabo text detection/extraction in our map image. It indicates where the tool struggles and where we might want to direct our attention in future work to improve results.
Latest posts from us


