Computational Approaches to Ordnance Survey maps
The Space and Time Lab investigates spatiotemporal challenges and questions arising from the digital primary source collections being used in Living with Machines.
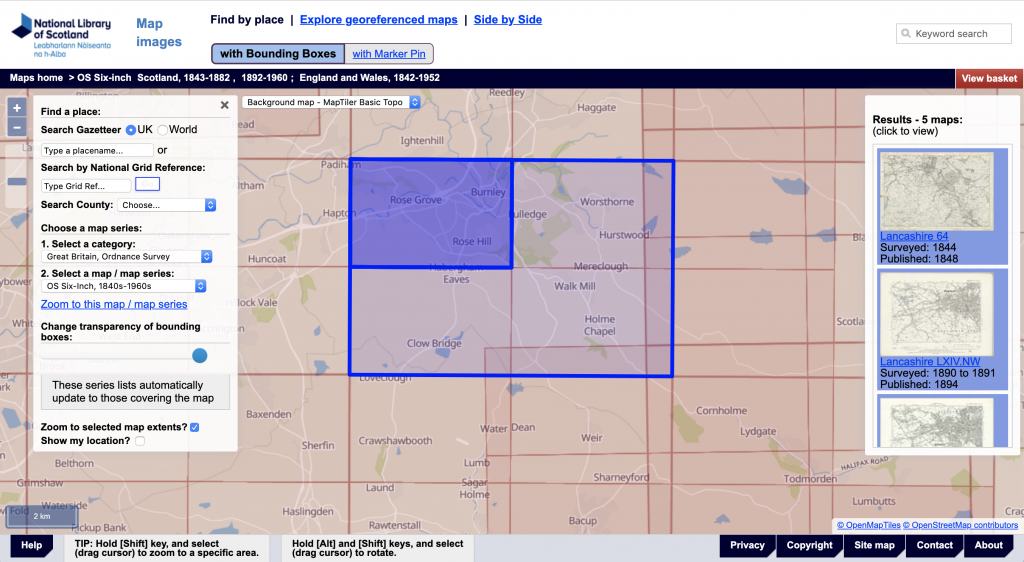
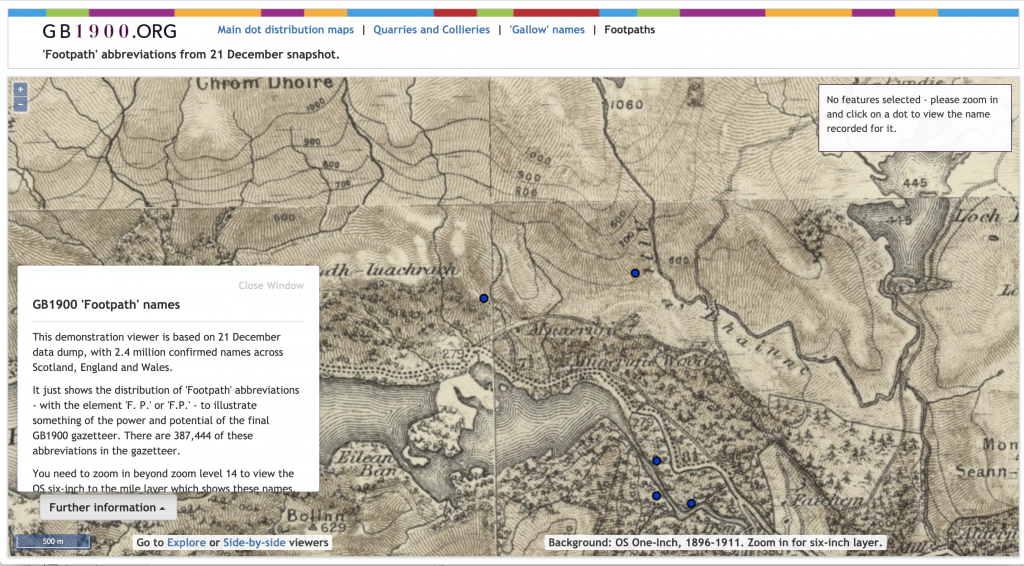
In this first stage of work, we are testing image analysis and computer vision methods on digital images of nineteenth-century British Ordnance Survey (OS) maps shared by the National Library of Scotland (NLS – and thanks Chris Fleet!). In addition to the map sheets (and their metadata from NLS catalog records), we also will use the recently completed GB1900 dataset of text strings from the c. 1900 1 inch to 1 mile series of OS map sheets (view the data here, download it here). These crowdsourced text strings represent every instance of text on the sheets and are a rich source of training data for our work.
The Ordnance Survey–with map sheets printed from 1841 onwards–belongs to the first generation of national surveying projects in Europe and North America, on par with the Cassini survey in France and the later USGS survey for the United States. These surveys and the printed maps that resulted were based on triangulation, which makes them good candidates for georeferencing and computational analysis.
As representations of the built and natural environment of 19th- and early 20th-century Great Britain (we exclude the Irish parts of OS work since they are outside the scope of LwM), the maps offer a large enough corpus for us to test the waters of the relatively new area of automatic image analysis in Digital Humanities (DH).
We want to know:
- What information about the lived experience of industrialisation is embedded in OS map sheets?
- Can (and should) we develop new tools to make it easier to automatically extract information from historical maps for DH projects?
Our sample dataset of 8765 map sheets from the NLS includes maps at four different scales and for three different editions (roughly 1840-1880, 1880-1890, and 1900-1940) for the areas of Lancashire, Dorset, London, and all of Scotland (these areas correspond to sample data in our newspaper corpora, see table below).
| Series and Scale | Number of maps | Gigabytes |
|---|---|---|
| Town_Plans London 1890s | 746 | 427 |
| Town Plans England 1840s-1890s | 1172 | 624 |
| 25 Inch Lancs/Dorset 1900s-1940s | 3733 | 2040 |
| 6 Inch Scotland 1840s-1880s | 2034 | 1140 |
| 6 Inch Lancs/Dorset 1880s-1890s | 575 | 134 |
| 1 Inch Scotland/Lancs/Dorset/London 1850s-1900s | 319 | 105 |
| 1 Inch Scotland Lancs/Dorset/London 1890s-1900s | 186 | 69 |
| TOTAL | 8765 | 4539 |
Analysing data from the maps will allow us to understand the environments in which industrial activities occurred, how they were related to each other, and also to ask questions about who has been left out of our existing narratives. One of the opportunities that maps afford is an ability to ‘read’ geographical entities as proxies for social experiences, and to trace the pathways and horizons (e.g. access to certain spaces/services) of people’s lives.
They represent information about the spaces in which people worked, played, and lived. We can define relationships quantitatively (as a distance or path between two points) and qualitatively (e.g. what is ‘next to’ or distant from a place). We can also learn about the existence of entities which may not have been captured as sites of industrial events in other records.
Data we create from the OS maps will therefore permit us to view the contextual geography of industrialised life. Variously called map mining/processing/analysis, automatic or semi-automatic computational methods for identifying, classifying, or extracting information from map sources is a new and experimental method that is itself an area of research to which we hope LwM can make a substantial contribution.
Digitising map features with human labour is expensive, time-consuming, and not error-proof. Without these computational methods, the information contained in the corpus of OS maps is difficult to “unlock” at scale. Since we want to compare how these maps change over time and scale and how the features they contain vary over time and space, being able to query the many thousands of maps automatically will be an immense advantage.
In addition to providing some initial datasets drawn from map features that represent industrial activity, this Minimum Research Output (MRO) will provide simple prototypes of analysis we can do using computer vision methods on historical map content. It is minimal because it is dependent on skilling-up members of the LwM team so that we can pursue more complex tasks at a later date. It will not resolve major problems or develop new computer vision methods, but will in the first instance instead be limited to those tools already in existence within the research community.For example, we have begun by evaluating the map processing research tools created by the Spatial Computing & Informatics Laboratory at USC.
Planned tasks:
- Image analytics: Perform basic indexing options such as pixel density analysis.
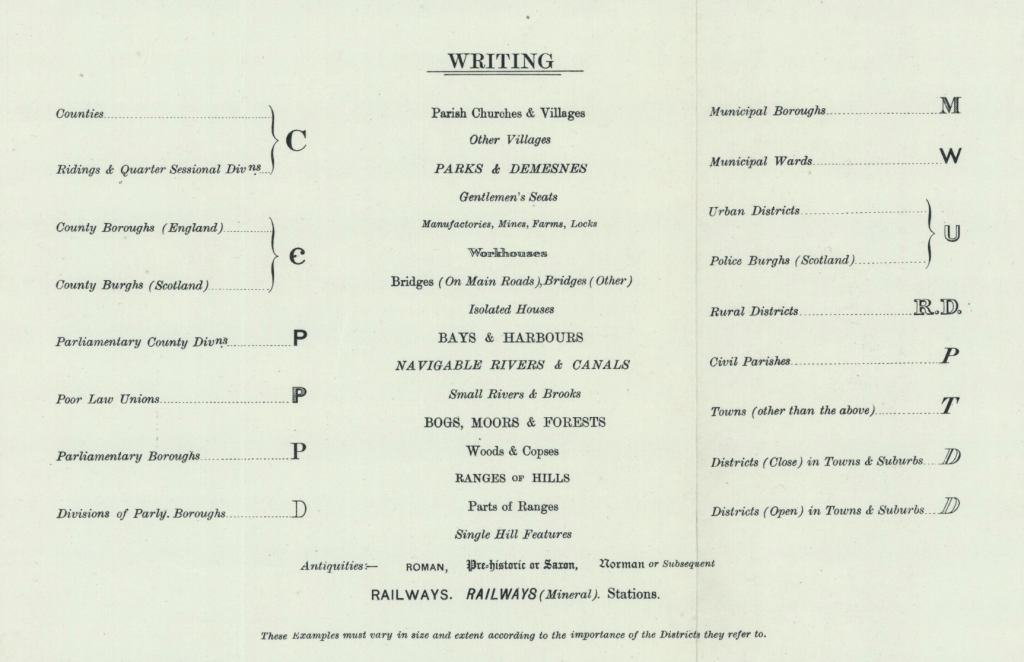
- Text Segmentation and OCR: Identify text that refers to ‘manufactures’, ‘works’, and other industrial terms.
- Text + Visual Identification and Classification: Match text + visual information (factories, depots, stations, etc. with non-unique building forms).
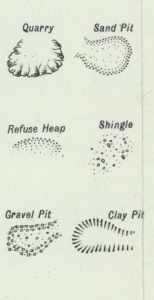
- Entity identification: Identify unique symbology related to industrial sites (quarries, mines, etc.).
- Synthesis: combine and visualise information from other sources with data from the maps to understand spatial distribution of certain events/ideas/etc.
Spatial analysis of map features provides information about structures/infrastructures that emerge/disappear in the landscape. Proximity/distance/distribution are all measures, for example, that would help us understand the visibility and potential for interaction that people had with industrial activities and objects. After creating datasets that document where certain kinds of entities appear on the maps (and in a geospatial coordinate system), we will use simple visualisations to respond to historiographical conversations about, for example, the importance of rural industrialisation and the ways that factory/worksite distribution affected community formation.
The maps represent the landscape surveyed and printed by the OS, using a combination of visual and textual rhetoric. It is not a ground truth. Just as the LwM Sources lab queries the nature of newspaper circulation and bias, we ask how the maps present a certain picture of 19th century life through the work of the surveyor and printer. Doing so contributes to our understanding of how particular kinds of sites and spatial relations have been inscribed into the narratives of 19th c. history. Acknowledging this complexity, we bracket much of this kind of evaluation of the OS map history and bias for a future phase in coordination with the Sources lab.
Planned outputs:
- Notebooks for reproducible tutorials for performing basic experiments with OS maps;
- Geodatabase of maps, map metadata, annotations to maps, identified and classified map entities;
- Visualisations of entities paired with preliminary written interpretations of how this affects historiographical claims about the lived experience of industrialisation;
- White paper evaluating computer vision tasks with OS maps.
Latest posts from us


