nnanno: a tool to help work with Newspaper Navigator images
Newspapers are a visual medium, communicating not only through text but also through visual information, including photographs, maps and other images. Research on historic newspapers, particularly with digital methods, has focused primarily on the text contained in the newspapers. However, there is potentially a lot to be learned by also looking at the visual content in newspapers as is discussed in The visual digital turn: Using neural networks to study historical images.
One of the reasons for this focus on the text was a lack of tools for working with images easily, particularly at scale. With the developments in computer vision powered by deep learning-based approaches, this type of research increasingly possible. A recent project, Newspaper Navigator, from Benjamin Lee and the Library of Congress Labs extracted visual content from the Library of Congress digitised Newspaper Collection, Chronicling America. This visual content includes photographs, comics, maps ads etc. The dataset offers a valuable resource to people wanting to explore the visual content in these historic newspapers.
We’re happy to share a new tool, nnanno, produced as part of the Living with Machines project, which aims to help work with this data.
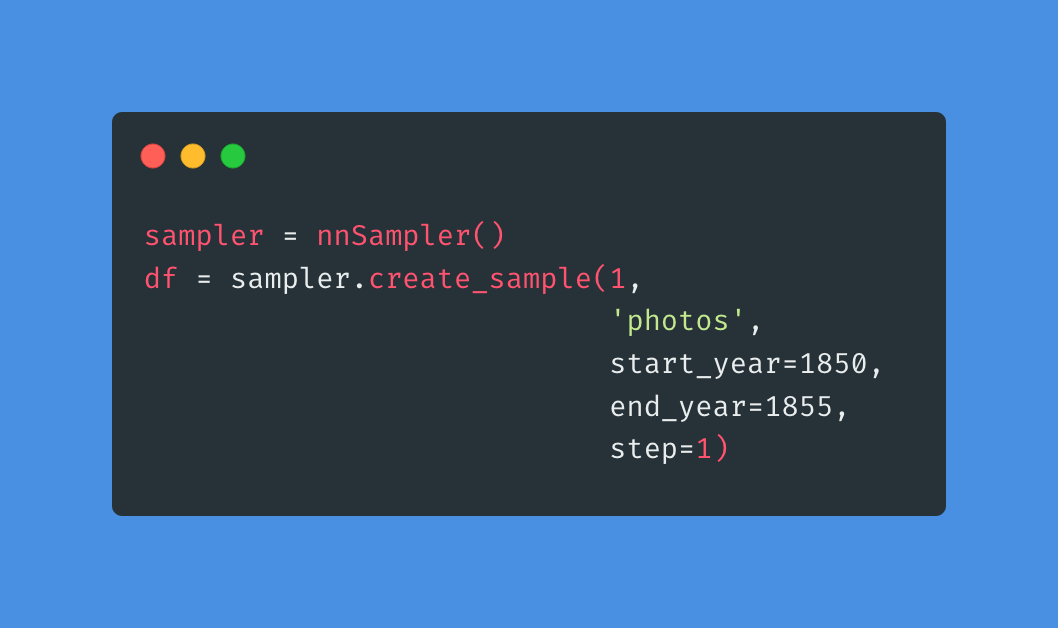
nnanno was created as part of the prep work for a forthcoming series of Programming Historian lessons on computer vision for humanities research. nnanno helps with sampling from the newspaper navigator dataset, downloading images, annotating and experimentally apply computer vision models to the newspaper navigator data.
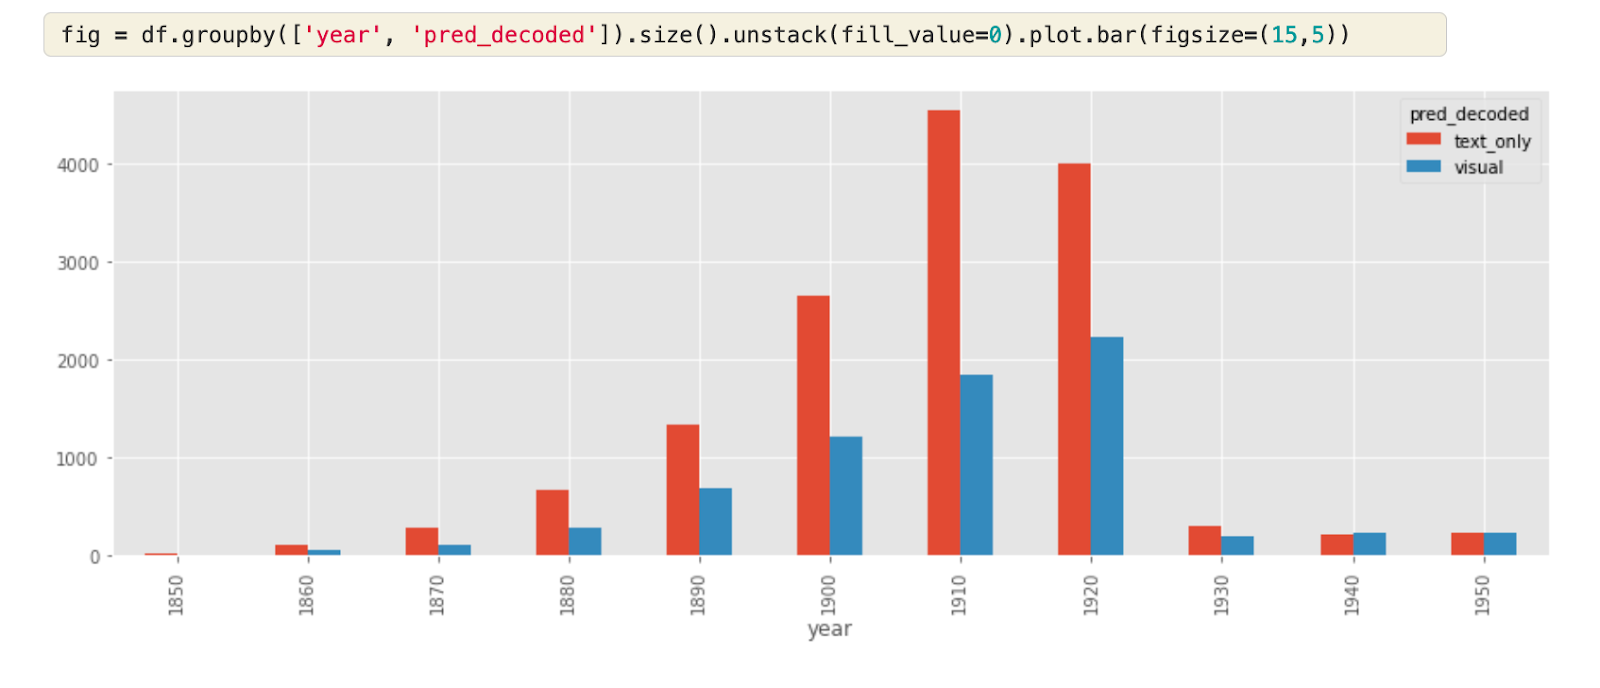
The GitHub repository for nnanno contains a series of notebooks that provide an ‘end-to-end’ example of creating a sample from Newspaper Navigator, annotating the sample, training a model using at_fastai, running the model and using the outputs of that model with a focus on the use of advertising in historic newspapers. This series of notebooks hopefully demonstrate how computer vision methods have become accessible to more researchers without the need for extensive computational resources or large amounts of training data.
We would love any feedback from people about the tool and the accompanying tutorials. The easiest place to leave that is in a GitHub issue. If it is your first time creating a GitHub issue, you can find documentation explaining the process. Alternatively, you can use one of the other methods of contacting us.
Latest posts from us


