A quick tour of two counties
Our initial newspaper data comes from the British Newspaper Archive, thanks to the British Library and FindMyPast. We initially sampled two contrasting counties: Lancashire in North West England (industrialised), and Dorset in South West England (much less industrialised). Here’s a quick tour of the data we have (treating both counties as one sample):
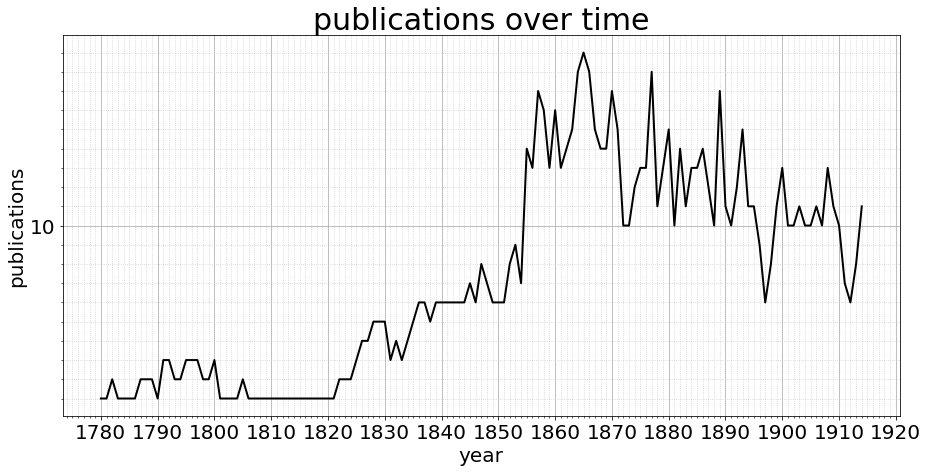
Total number of newspaper publications: 64
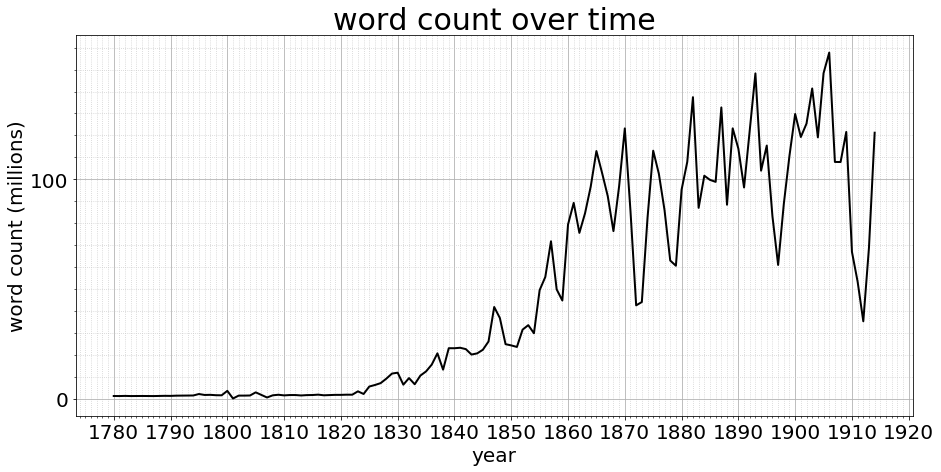
Total word count (millions): 6360.122871
That’s a whopping six thousand million words of content, which depending on your definition of billion, might be six billion words. Or not. What is telling, is the slow ramp up of both the count of publications, and with that their word count. This means not all years are equal, and we must during the project statistically normalise (BTW bonus retro web content) the corpus if we are to compare years in any like-for-like way.
Let’s dig deeper. The newspaper pages have been segmented into a number of different areas prior to LwM receiving them. Are these classifications useful? E.g. to separate articles (full of news) from adverts (full of repeating not-news)?
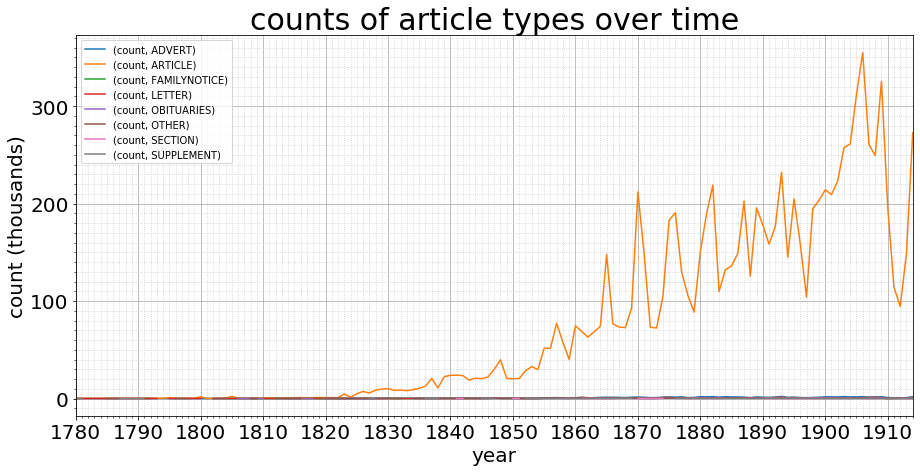
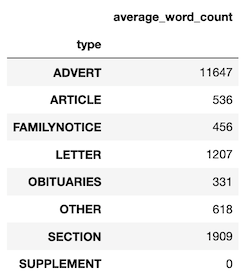
Total article count (millions): 10.029062
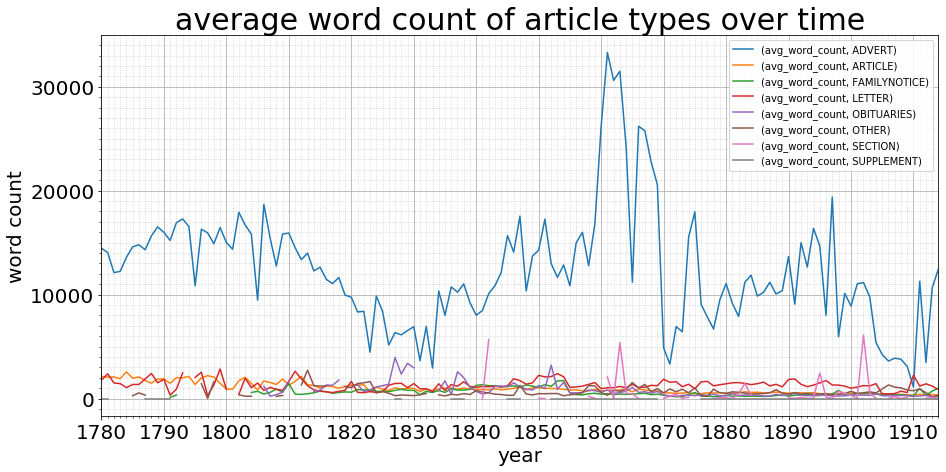
That doesn’t seem right. The article type dominates, to the extent that I wouldn’t trust this data set, as the other lines barely move from the horizontal. Surely there is more to adverts (and other content) than that? Well, actually there are:
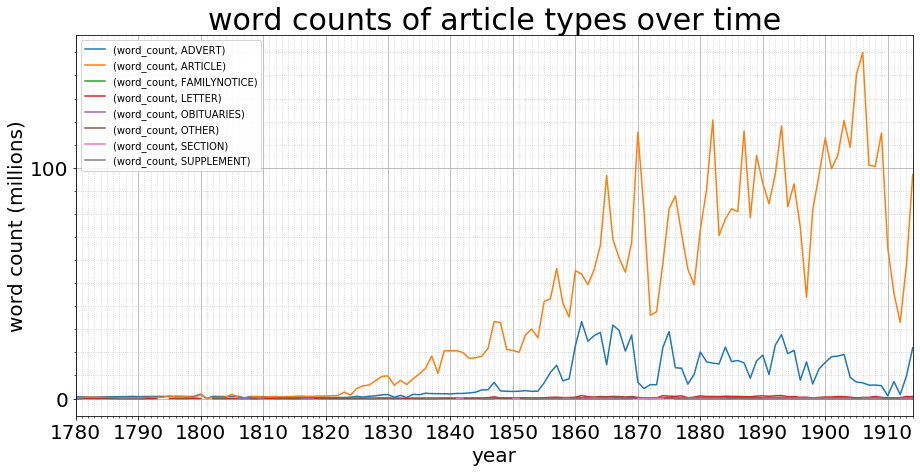
This looks more like it, so we have a (comparatively) small number of wordy adverts and a large number of concise articles. Let’s see what that word count looks like if we do normalise the corpus, and instead of looking at raw numbers, we look at the proportion of each type:
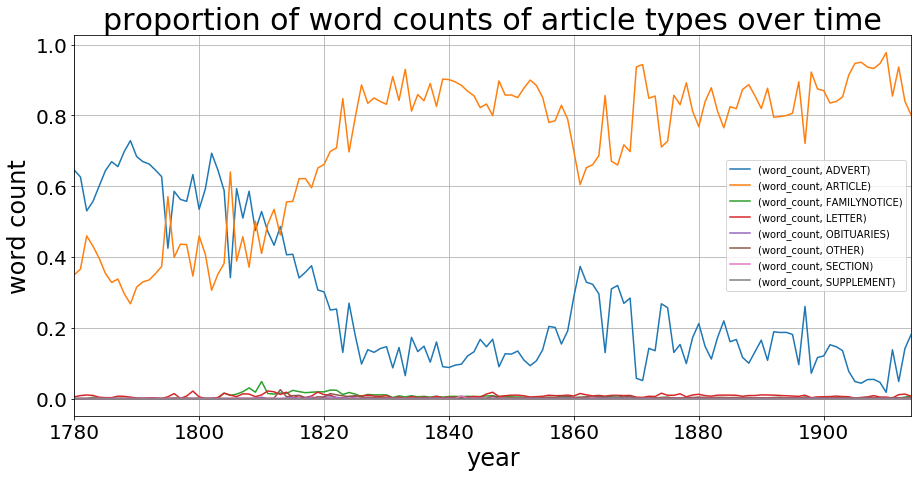
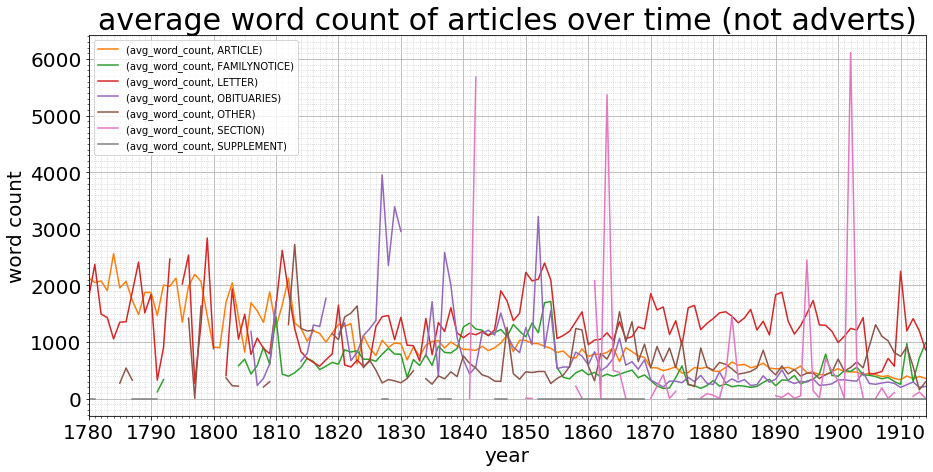
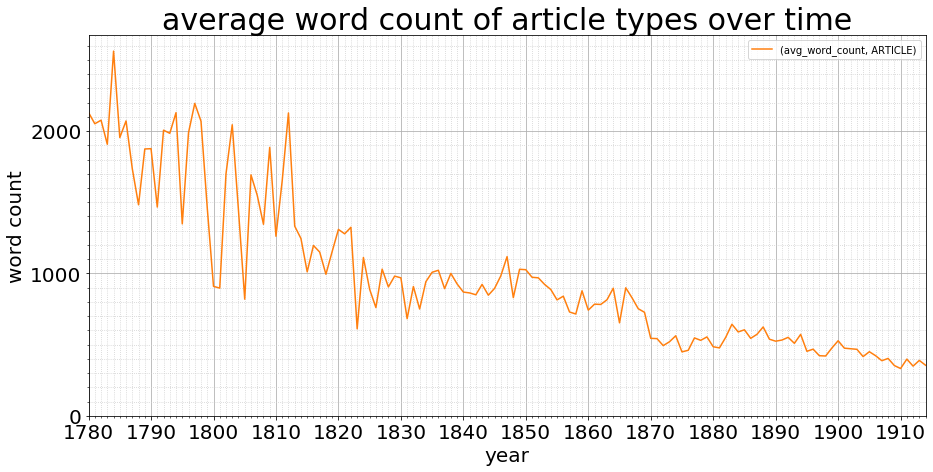
There’s still something going on between 1780 and 1830, but from then it’s pretty stable. A quick glance at the raw data makes me think we’re just short of samples: many of those early years have at most three publications making up the data, and we know from the graphs their word count is low. The article type length is fairly stable as it descends from 2,000 words to 500 words across the 135 years (still a drop during the stable data years from 1830):
The exploration here demonstrates how important it is to fully understand the makeup and materiality of our content, and the various biases of our data as it moves from physical to digital. Also, how distant and closer views can illuminate different perspectives and often pose more questions than they answer. Do share your thoughts and observations, on the data, the methods, and what you see?
Latest posts from us


