Creating a national picture: digitising Ordnance Survey maps
Ordnance Survey (OS) maps are incredible resources for researchers interested in British history, such as the Living with Machines team who have developed the MapReader software library to analyze historical maps at scale. These maps contain details about the built and natural environments that are uniquely captured on a national scale over a period of about 50 years. (The OS also mapped Ireland, however Living with Machines has not investigated these maps – the OS200 project is focused on this part of the OS archive and you can learn more here.) Surveyed and printed at the height of industrialisation, there is no other primary source that provides a continuous, visual representation of Britain’s rapidly changing landscape.
To make OS collections ready to use with methods like MapReader, the British Library (BL) has scanned and georeferenced over 10,500 sheets of late nineteenth- and early twentieth-century large-scale Ordnance Survey (OS) maps from its holdings. This work helped fill gaps in the coverage of maps already available online from the National Library of Scotland (NLS).
Before undertaking any kind of analysis with digital map collections, Katie McDonough and Olivia Vane set out to understand what they contained. Working closely with map curators at both the NLS and BL, we began by assessing what had been digitised from the voluminous OS collections in Edinburgh and London. Part of this work has subsequently developed into the Macromap project led by Vane (see it in action here). Such an approach to using information about a collection to guide digitisation and research decisions is useful for many kinds of media: as Kaspar Beelen and other LwM colleagues have shown for newspapers, this Environmental Scan method is a best practice for creating and using digitised materials in historically-sensitive ways.
A survey of digitally available maps
The National Library of Scotland has digitised tens of thousands of OS maps. We negotiated access to their maps for the Living with Machines project team. These maps are available to users in a variety of ways, from a browsable interface to a web map tile service.
OS maps come in different scales that show more or less detail per inch of map. They also come in different ‘editions’, depending on when the map was produced and printed. While NLS coverage of Scotland is relatively complete at the 6-inch and 25-inch scales and editions, that of England and Wales isn’t.
Our survey of the metadata shared by the NLS allowed us to explore and document gaps in the collection’s coverage of digitised OS maps which were relevant for our research. While this work aims to supplement the existing digitised collection for only one edition and one scale, one can see this as a first step in producing complete sets of research-ready OS maps for multiple scales and editions.
In the figure below, you can see one of Vane’s visualisations that was useful in locating opportunities for new digitisation.
Of all the scales of OS maps, the 25-inch to the mile series has the largest gaps in England and Wales. Establishing a complete national snapshot of this scale for the 1st edition will make new kinds of analysis possible. We therefore decided to focus our energies on supplementing the NLS collection of digitised OS maps with BL maps for this edition and scale.
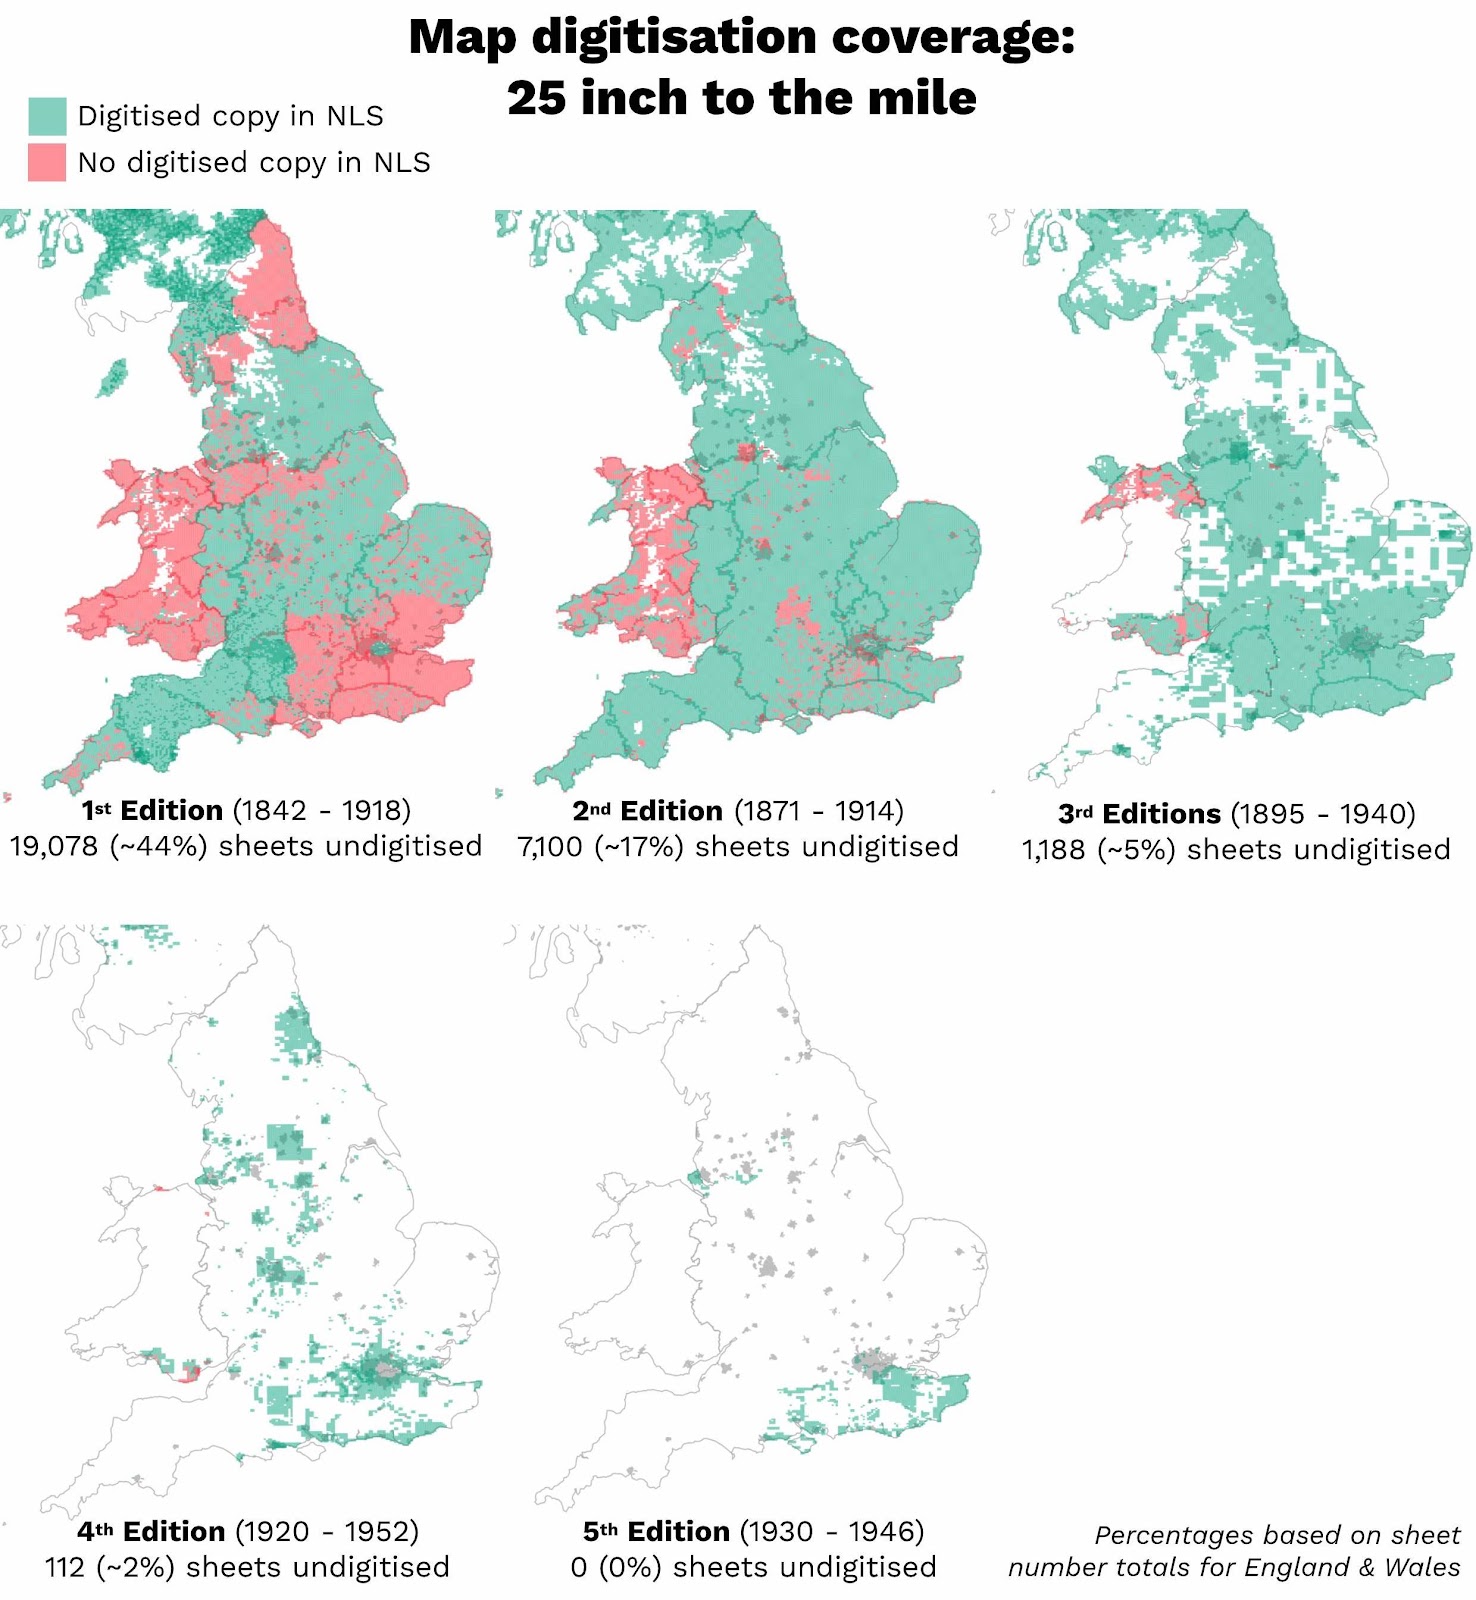
Fig 1. Figure originally printed in Kasra Hosseini, Katherine McDonough, Daniel van Strien, Olivia Vane, Daniel C S Wilson, “Maps of a Nation? The Digitized Ordnance Survey for New Historical Research,” Journal of Victorian Culture 26, no. 2, April 2021, pp 284–299, https://doi.org/10.1093/jvcult/vcab009.
What did we digitise?
Given the existing availability of 2nd-edition OS digitised maps in the NLS collection across these scales, we were interested in improving access to 1st-edition maps at the 25-inch scale.
Thanks to Tom Harper, British Library Lead Curator of Antiquarian Maps, we located a set of more than 15,000 previously scanned 25-inch maps from the 1st and 2nd editions held at the Library.
Combining these with the NLS digital collection, we were able to understand the final gaps that needed to be filled to create a nationwide set of 25-inch maps. We compiled a list of sheets not yet digitally available at either institution and sent this to the Digital Services team at the British Library so that they could retrieve the sheets from the stacks and scan them.
Over 10,500 maps were digitised as TIFF files, a high-quality format that is standard in libraries and archives. Together with the digitised images identified by Harper, we now have over 25,500 new digitised maps.
At this level of quality, one can zoom in and see all the details of the map. However, to be able to use these maps with our research methods, the images should include geospatial metadata (e.g. they should be ‘geolocated’ so that we can position a map on the earth’s surface). To do this, we needed to create GeoTIFF files, which are TIFF files enriched with a metadata overlay including geocoordinates.
How did we achieve this at the scale of our digitisation project? Find out more in our next blogpost: Georeferencing Ordnance Survey Maps.
Latest posts from us


